Credit information and maturity profile
Key credit figures
| 2024 | 2023 | 2022 | 2021 | 2020 | 2019 | |
|---|---|---|---|---|---|---|
Return on equity (ROE), % | 21.3 | 12.3 | -2.6 | 8.6 | 5.8 | 9.0 |
Net interest-bearing loan capital | -777 | 35 | 481 | 4 | 394 | 726 |
Gearing | -0.31 | 0.02 | 0.23 | 0.00 | 0.18 | 0.30 |
Solvency, % | 37.4 | 37.0 | 35.3 | 38.6 | 38.1 | 40.8 |
Credit programmes
The information below is from the Financial Statements Bulletin 2024 published on 5 February 2025.
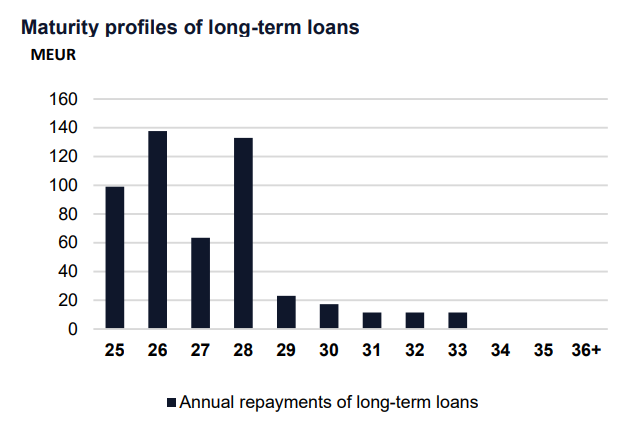
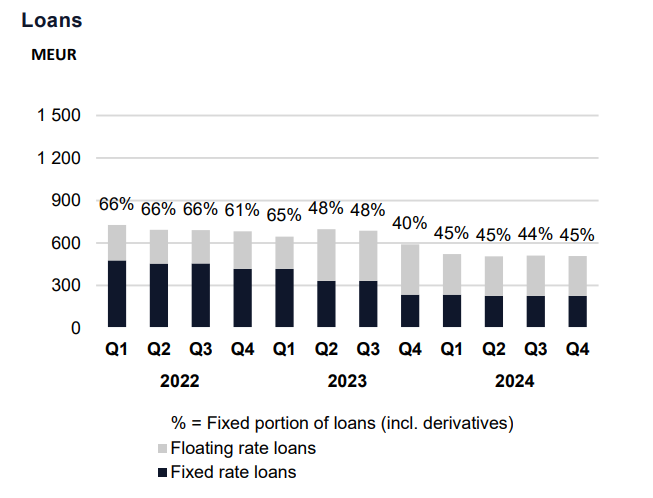
Wärtsilä’s net interest-bearing debt totalled EUR -777 million at the end of the period (35). The total amount of short-term debt maturing within the next 12 months is EUR 142 million. Long-term debt amounted to EUR 624 million.
Gearing was -0.31 (0.02), while the solvency ratio was 37.4% (37.0%). Equity per share was EUR 4.29 (3.78).
Ratings
Wärtsilä has not issued bonds to the market and thus has never had a company rating available or analyst coverage for debt instruments.
Maturity profile
Interest bearing loan capital
| 2024 | 2023 | |
|---|---|---|
| Non-current liabilities | 409 | 515 |
| Current liabilities | 99 | 76 |
| Loan receivables | -4 | 1 |
| Cash and cash equivalents | 1,557 | 819 |
| Net | -777 | 35 |


