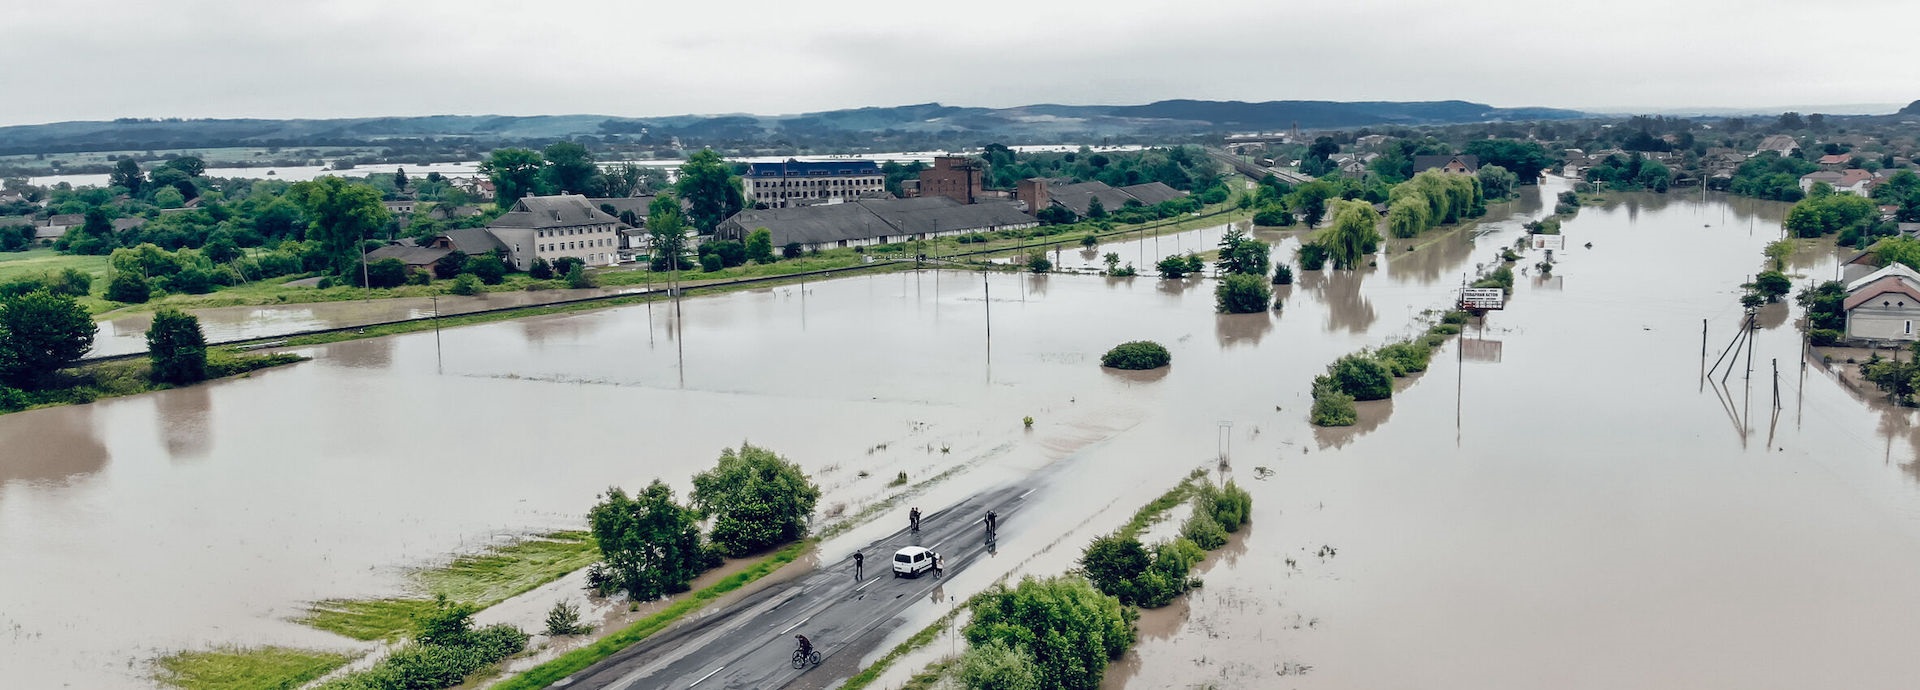

Historical data is crucial for predicting the rate, extent, and consequences of rising sea levels.
The potential worst-case consequences of rising global sea levels resulting from climate change are well established. Flooding of low-lying cities near ocean shorelines is one, the negative effect of soil salinity on coastal agriculture is another, as is the mass migration that could result from the rising water levels in these coastal areas.
An article in the journal Nature published in April 2021 states that between 2000 and 2019, as much as 267 billion tonnes of glacial ice has melted into the sea because of global warming, at a rate that has doubled over that period. This process accounts for about a fifth of rising sea levels, and it continues to accelerate as the planet warms.
To predict and plan for these changes, experts rely on meticulous scientific data, in many cases drawing on historical patterns and evidence.
One of the experts processing and providing that data is Andrew Matthews, Data Scientist at the UK’s National Oceanography Centre, which uses historical records to study changes in sea levels. Matthews and his colleagues provide the Permanent Service for Mean Sea Level, a facility that has collected sea level records from tide gauges since 1933, with some records even dating back to the beginning of the 19th century.
Aiming for longer records
“It's these records that form the basis of our understanding of how sea levels have changed over the past 200 years,” Matthews says. “We're based in the port city of Liverpool (in northwest England), where the tidal range is up to 10 metres, and studying these records lets us see how local tides have changed, too. Also, we can study the extreme events through a record such as storms that cause flooding, or even a tsunami. If we can make our record longer, we can get a more accurate estimate of how these things are changing.”
Sea level varies considerably across the globe, Matthews explains, and levels might rise faster in one place than in another. In parts of the northern Baltic, for example, the land level, not that of the sea, is rising at a rate of 8 to 9 millimetres annually, following the compression of the last Ice Age. Eventually, Finland and Sweden will be linked by a new land bridge.
“To really understand things on a global scale, we need measurements from across the world. However, the available records are mainly from Europe or North America, particularly before the 20th century, so any data we can recover from other areas is particularly valuable, especially if it's from the Southern Hemisphere,” he adds.
Low tech efficiency
Historically, records were gathered by manual methods that sound almost quaintly low tech by 21st century standards. “Water levels have been marked using tide poles for thousands of years, but we only know of systematically measured observations from the past few hundred years,” says Matthews. “The earliest recorded observations mainly come from scientists, such as the astronomers Nevil Maskelyne and Manuel Johnson, who measured tides on the island of St Helena in 1761 and 1826-7 respectively.”
Other sources are harbour authorities or navies, who needed data for accurate tidal predictions so ships’ captains would know when it would be safe to enter port.
“Some of the earliest measurements in Liverpool were taken by the dockmaster William Hutchinson, who between 1764 and 1793 recorded the time and height of high tides,” Matthews says.
Automatic gauges were developed, continuously recording the height by means of a device floating on the surface of the water. “This device was connected through pulleys and gears to a pen, which would chart the sea level on a piece of paper attached to a slowly revolving drum,” says Matthews. “Nowadays, we tend to use either pressure sensors on the seabed or devices on the dockside that bounce either radar or acoustic pulses off the surface of the water.”
Ports depended on accurate tidal information to keep trade flowing, and agencies monitoring land movement were looking for changes of a few millimetres per year, he says. “Sometimes this work can involve a lot of detective work. A recent US study to recover large amounts of 19th century data from Boston Harbour on the East Coast of the United States involved finding information in libraries, universities and various state and national archives about the design, construction and operation of the harbour.”
Individual records need to be treated with caution, however, as changes can result from land movements or changes in river flow near estuaries as well as sea-level rise.
“To allow a wider view, we produce an interactive map that shows how relative sea levels change across the world during different periods. This gives a good overview of broad trends, such as the apparent sea-level fall in the northern Baltic as the land rises even faster than the sea does. You can also see sea-levels rising faster on the eastern coast of the United States than on the Western coast.”
Calling out for information
“Our focus is on digitising tabular data from the Northwest of England that will help us understand how tides have changed over the past 200 years, but it's also an investigation into whether it's possible to use crowdsourcing to digitise tide gauge data,” says Matthews.
The PSMSL has long accepted contributions of sea level data and starting this year, is asking the public to help digitise data from old logbooks through the crowdsourcing website Zooniverse.
The current project is just the beginning, Matthews says.
“We have been in contact with various groups looking to turn paper records into usable data from a variety of areas, including meteorology, hydrology and seismology. Beyond that, there will be information about sea-level and tide gauges in archives, libraries, harbour offices and many more places that we don't know about yet. If anyone has any information about data that may have been missed, we'd love to know about it!”


